|
Use genfromtxt or loadtxt in numpy.
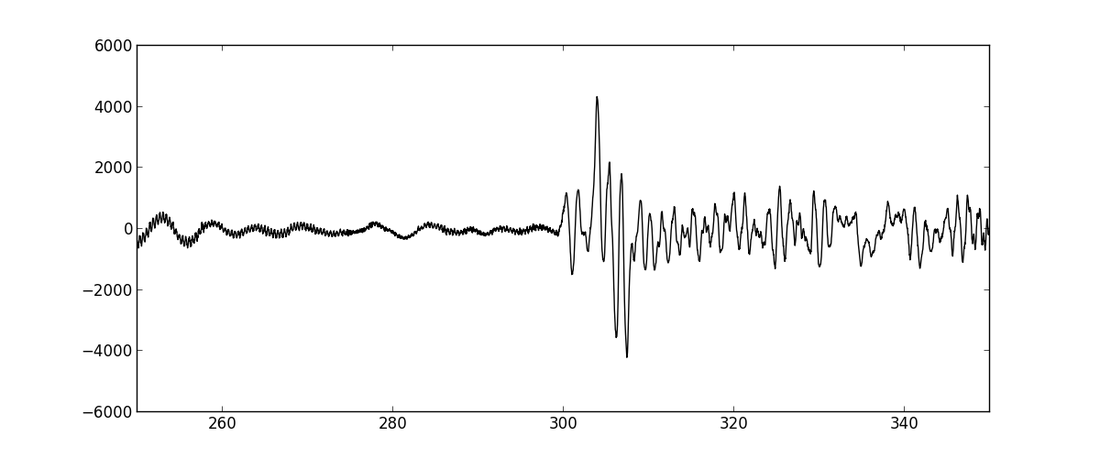 For further information on pyplot: http://matplotlib.org/users/pyplot_tutorial.html For information about obspy: http://docs.obspy.org/tutorial/
 When it comes to plotting geospatial data in command-line, GMT (Generic Mapping Tools) rocks, period. It is very fast and once you get over the syntax, pretty easy to use. The only thing it can't do is to handle transparency. That's why I started using matplotlib and basemap for anything that I needed transparency for.
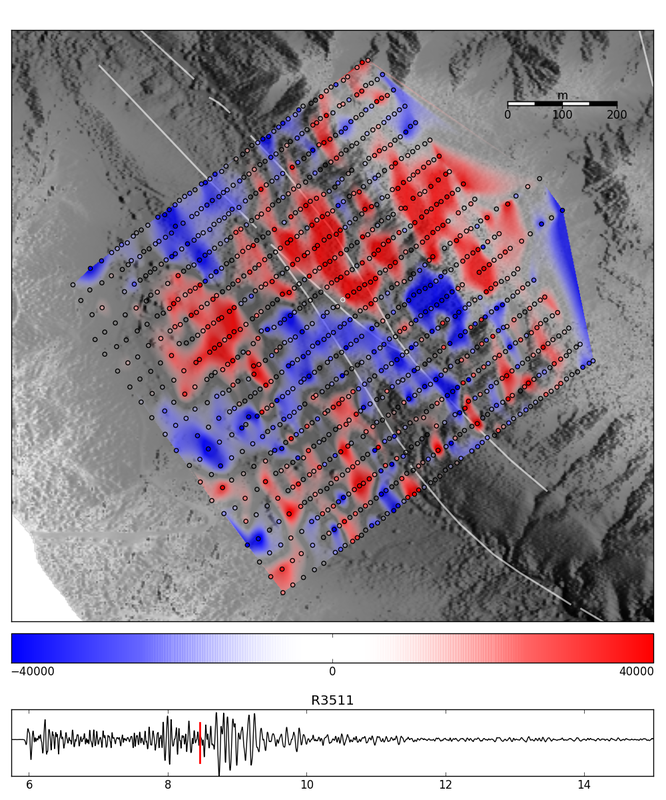
In the figure above, I've plotted the seismic amplitudes right after a magnitude 2 earthquake from ~1100 geophones installed on San Jacinto Fault. Thanks to the transparency in the color scale, you can compare the topography with amplitudes of the seismic waves. The only problem with basemap that I've found so far is that it is very difficult to make the tick marks at the map frame. I hope they'll solve that problem soon. (I'll post the code I've made here soon) |
| Yaman's Homepage |
|
