For further information on pyplot: http://matplotlib.org/users/pyplot_tutorial.html
For information about obspy: http://docs.obspy.org/tutorial/
For information about obspy: http://docs.obspy.org/tutorial/
from obspy.core import read
import numpy as np
import matplotlib.pyplot as plt
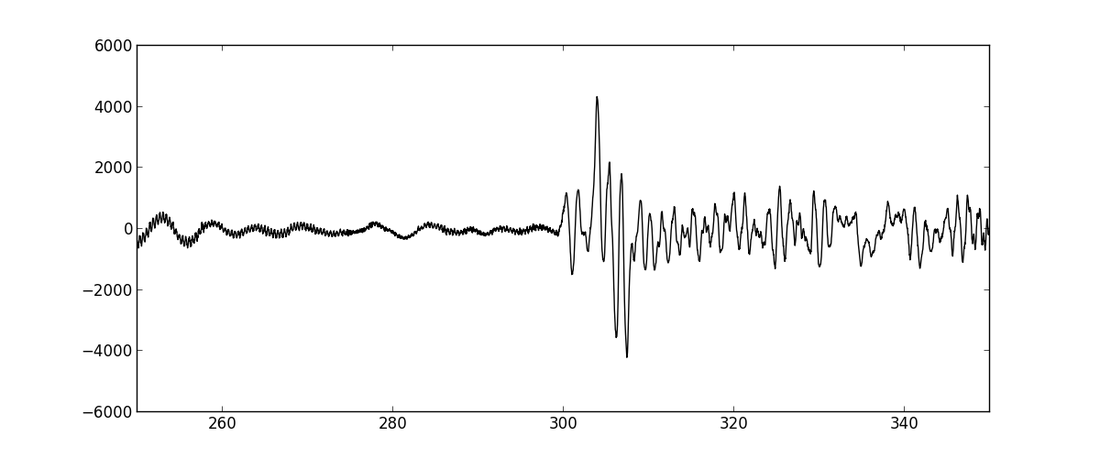
st=read('37014039.CI.LDF.BHZ.sac') #read almost any seismic format file
tr=st[0]
t=np.arange(0,tr.stats.npts*tr.stats.delta,tr.stats.delta)
f=plt.figure(figsize=(12,5)) #set figure size
plt.plot(t,tr.data,'k') #plot the trace
plt.xlim([250,350]) #set the time range
plt.show()
#you can adjust and save it from the window